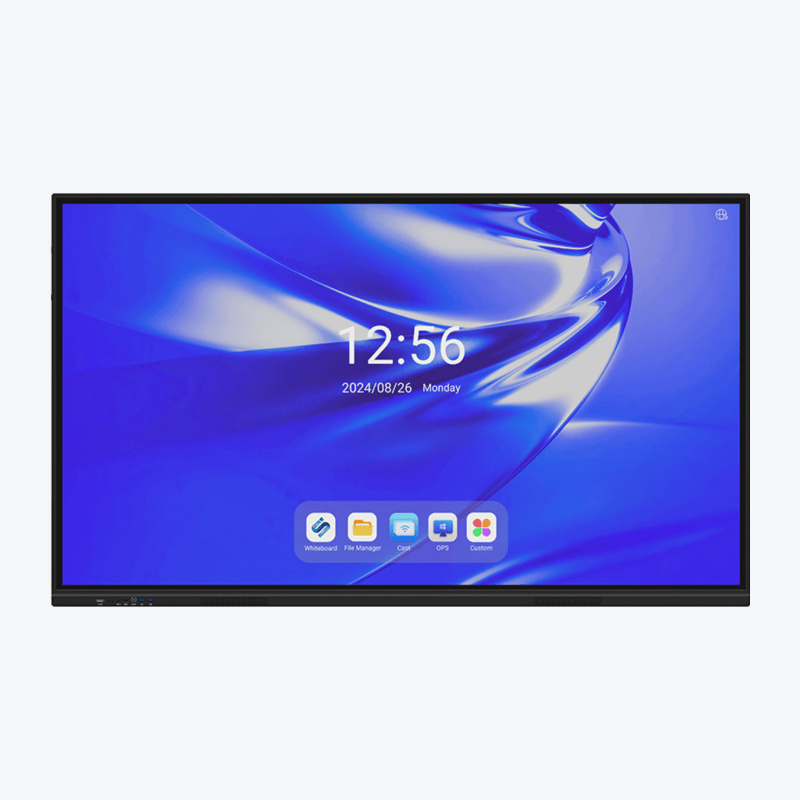
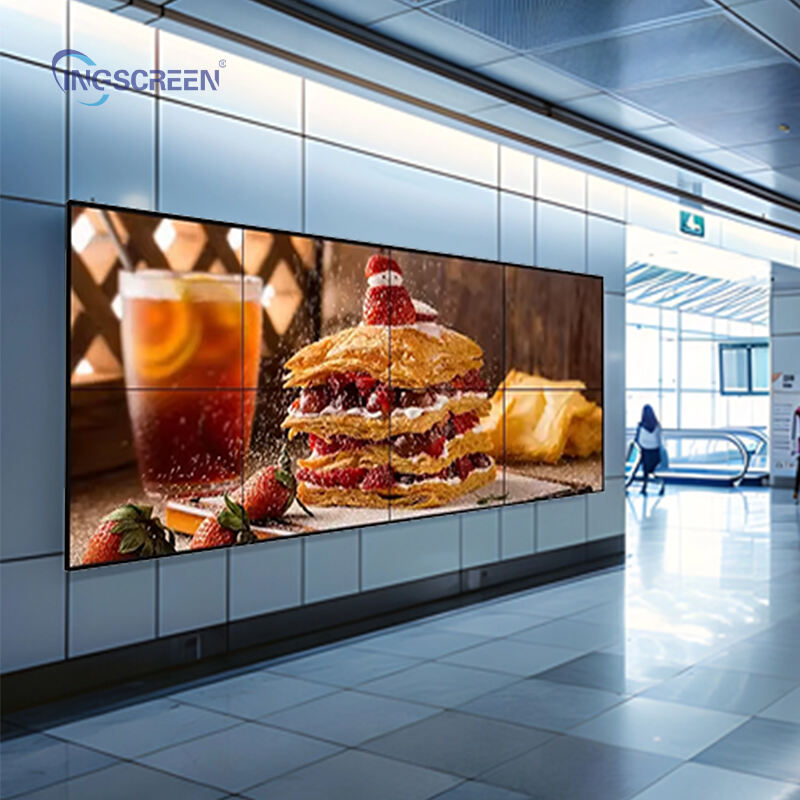
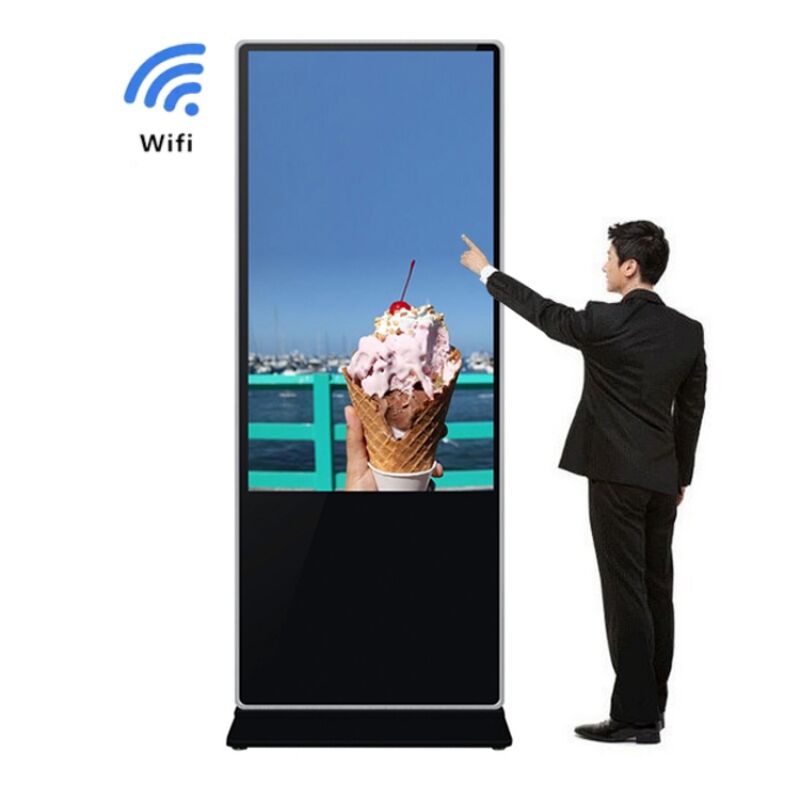
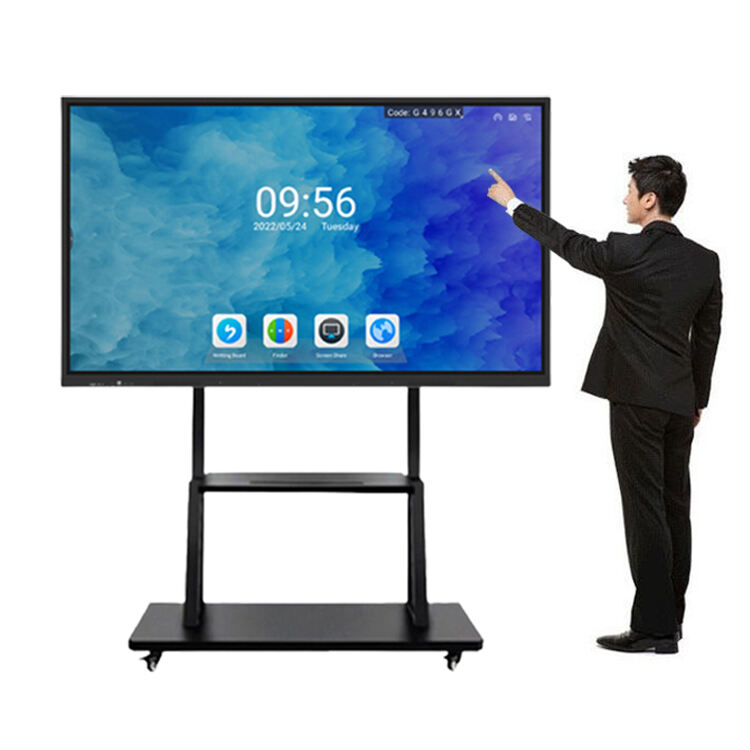
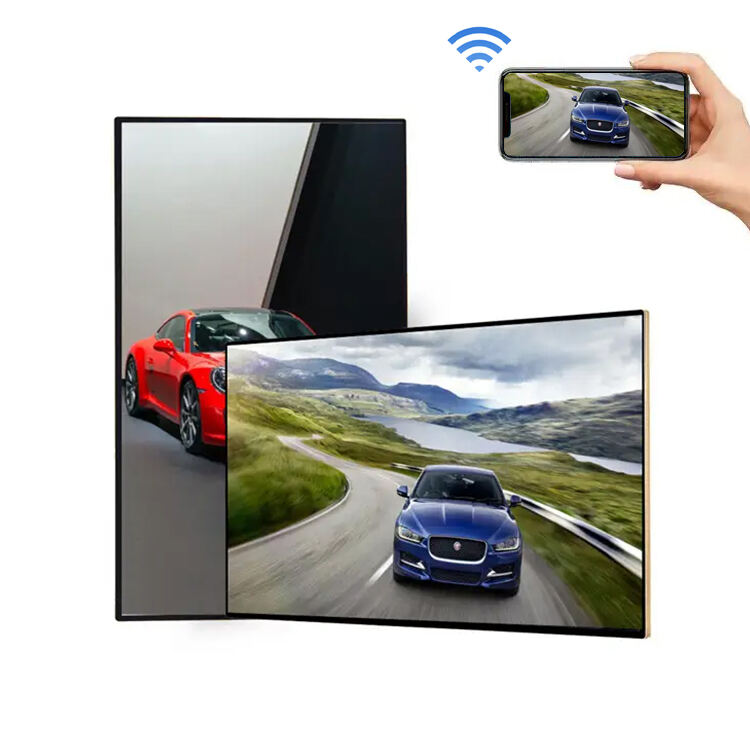
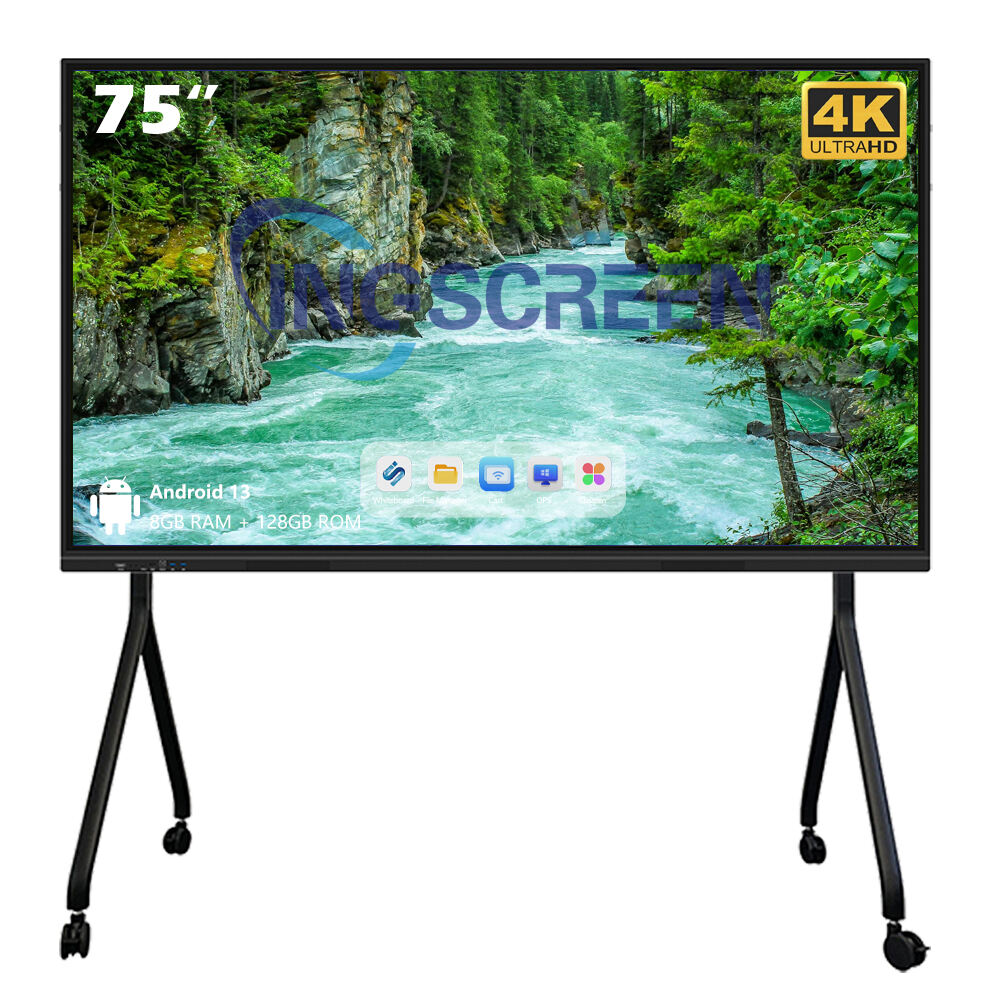
floor standing touch screen kiosk
The floor standing touch screen kiosk represents a cutting-edge interactive solution that combines robust functionality with user-friendly design. Standing at an optimal height for comfortable interaction, these kiosks feature high-resolution displays with responsive multi-touch capabilities, allowing users to navigate through content effortlessly. The system is powered by advanced processing units that ensure smooth operation and quick response times, while the industrial-grade components guarantee durability in high-traffic environments. These kiosks come equipped with various connectivity options, including Wi-Fi, Ethernet, and optional 4G/5G capabilities, ensuring constant network access. The display typically ranges from 32 to 65 inches, offering crystal-clear visuals with anti-glare coating for optimal viewing in various lighting conditions. Security features include tamper-proof hardware, secure mounting systems, and software protection against unauthorized access. The kiosk's modular design allows for easy maintenance and component upgrades, while the integrated thermal management system maintains optimal operating temperatures. Additional features can include built-in cameras for interactive applications, NFC/RFID readers for secure transactions, and barcode scanners for quick information retrieval. These versatile units find applications across numerous sectors, from retail and healthcare to transportation and education, serving as information points, self-service stations, or interactive advertising displays.
